
Ticket sales reports with answers on demand
From real-time ticket sales reports to one-click settlement PDFs and an at-a-glance analytics dashboard, ThunderTix puts every number at your fingertips. And when you have a question the reports don’t answer, Bolt — our AI assistant — and the ThunderTix MCP connector turn plain-English questions into custom reports and charts.
Your whole operation, at a glance
The ThunderTix Analytics Dashboard distills your entire operation into one view, refreshed nightly — and lets you compare the current period against a previous one for instant trend analysis.
- Revenue, donations, and customers at a glance, with monthly trends in orders and tickets
- Upcoming event performance and ticket activity by day
- Cart abandonment insights benchmarked against other venues
- Email delivery and survey engagement monitoring, plus declined-order follow-up
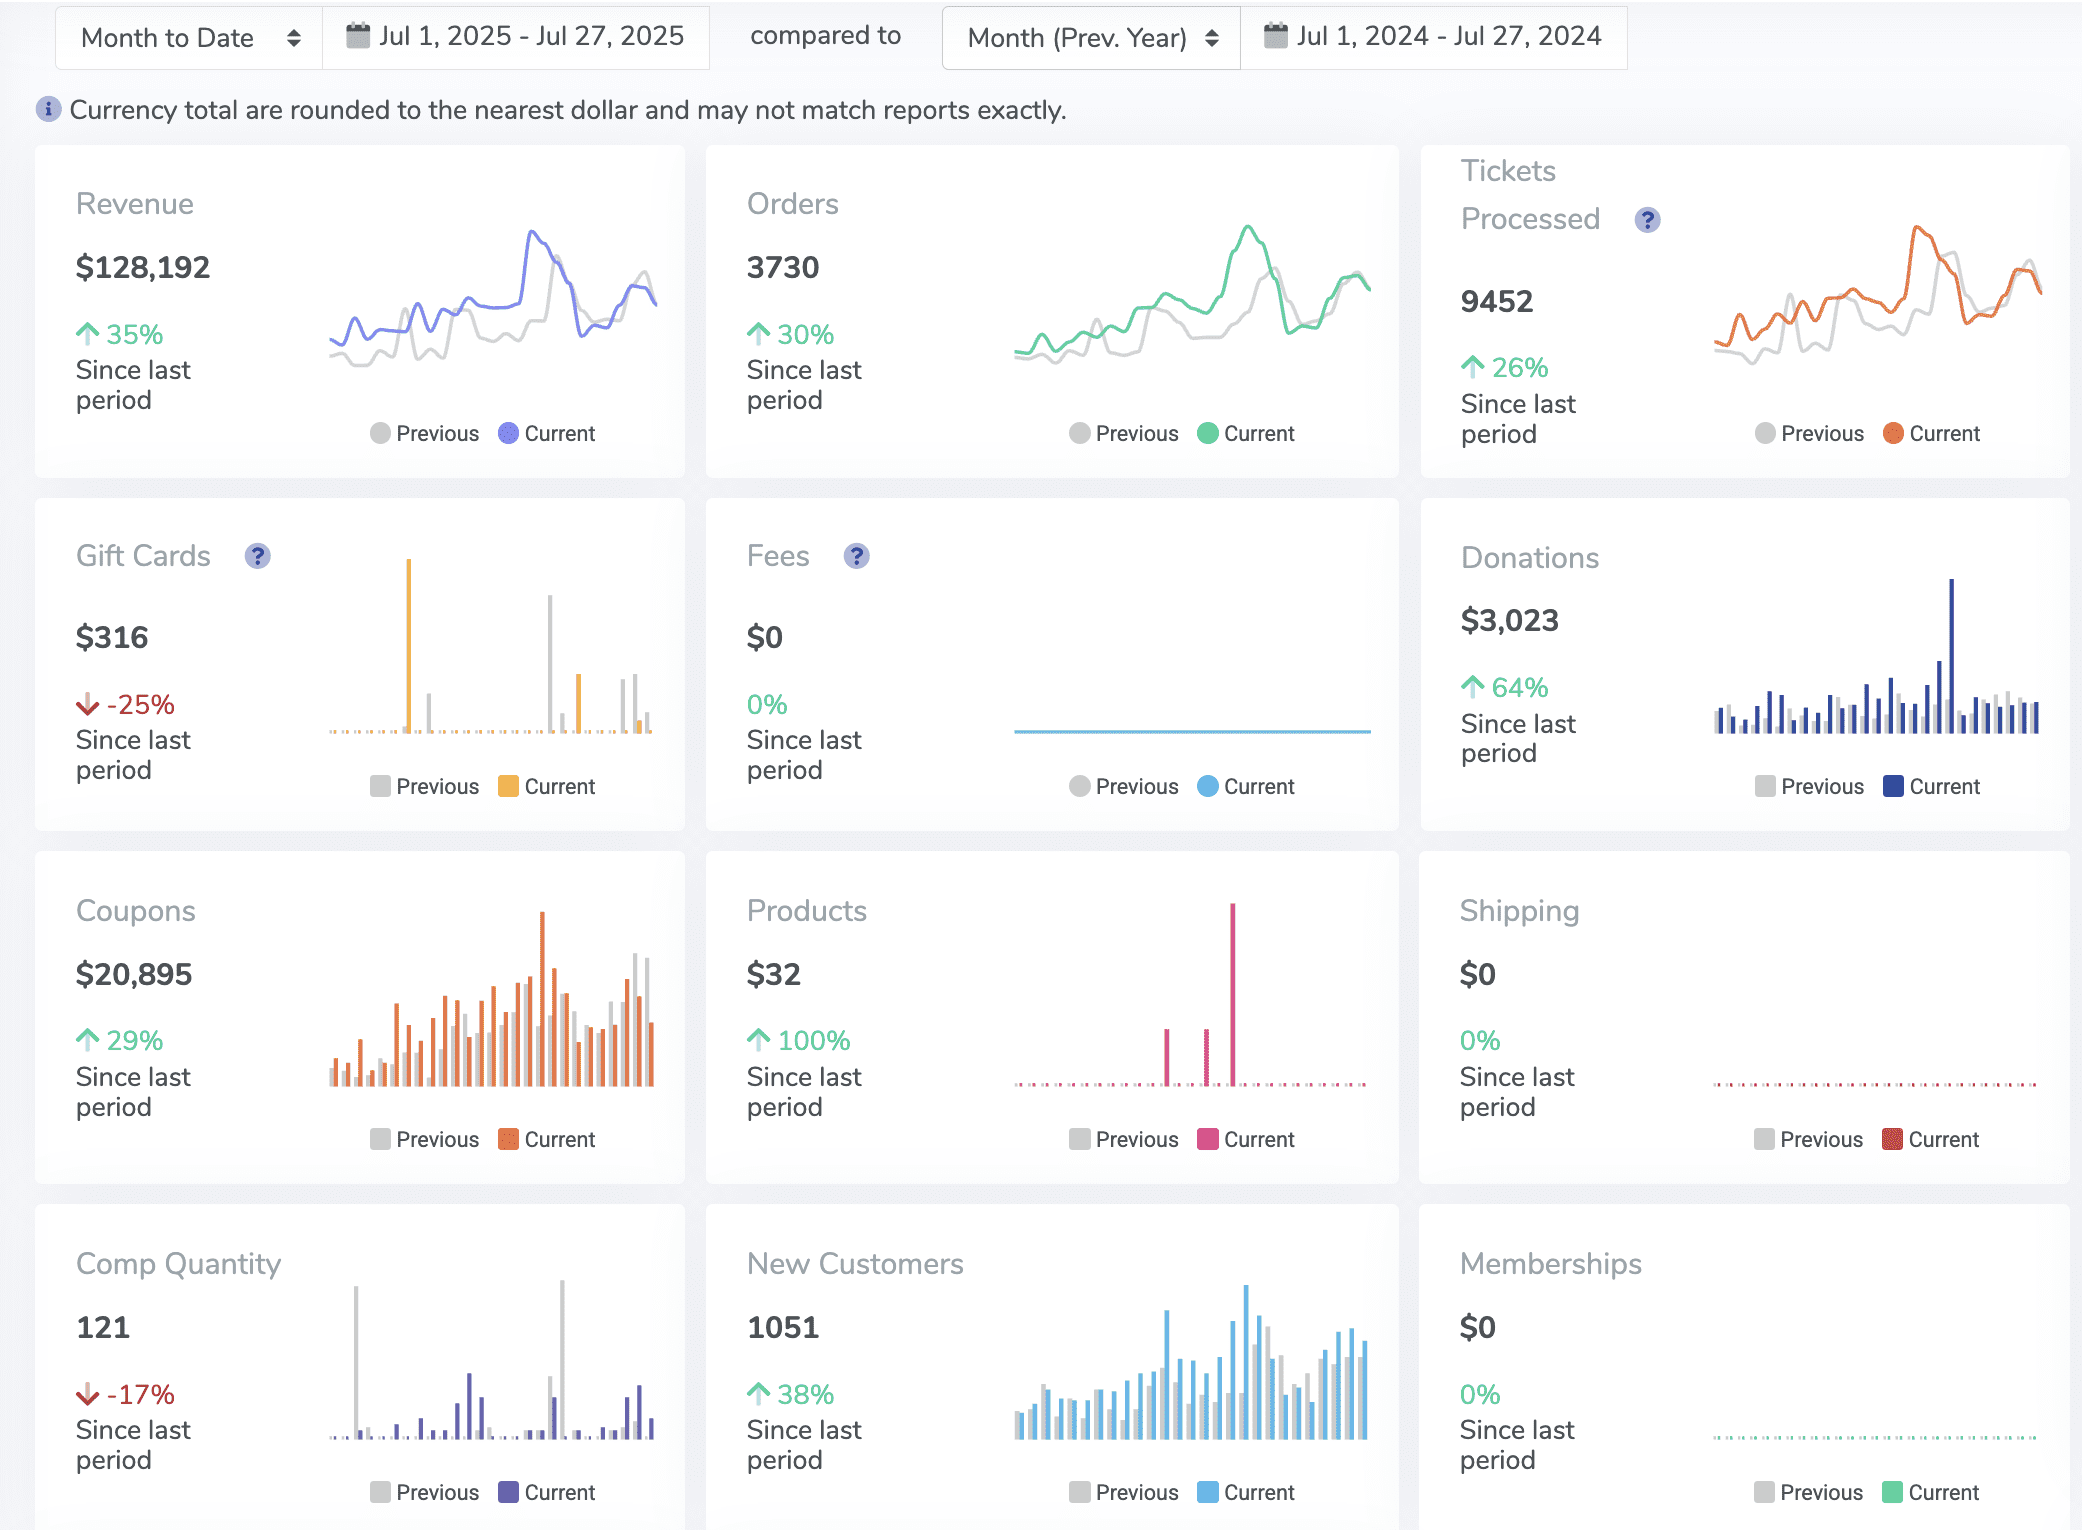
Month-to-date vs. previous period — quick analytics at a glance.
Ask a question, get the answer — day or night
Bolt is the AI assistant built into ThunderTix. Instead of hunting through menus or waiting on a reply, ask Bolt in plain English — how a show is pacing, where to find a report, how a fee was calculated — and get a rapid, accurate answer at any hour. Bolt works from your live ThunderTix data and our full documentation, so answers arrive in seconds, even at midnight on opening weekend.
- Instant reporting answers — sales pacing, comparisons, and where to find any number
- Always on — rapid help at all hours, including nights and weekends when shows actually run
- Grounded in your account — answers reflect your events, orders, and settings
Totally custom reports, written in plain English
The ThunderTix MCP connector links your account to AI assistants like Claude. Ask a natural-language question about your data — no report builder, no SQL, no waiting on a programmer — and get back exactly the analysis you asked for. Then ask Claude to visualize it as graphs and charts you can drop straight into a board deck.
- Ask anything — “compare weekday vs weekend sales by genre this season”
- Visualize instantly — bar charts, trend lines, and tables generated on request
- Your data stays yours — secure, account-scoped access you control
Tickets sold by day of week · last 6 months
Every ticket sales report your box office needs
A full suite of built-in ticket sales reports for revenue, attendance, customer behavior, and reconciliation — no setup required.
Settle a single night — or the whole run
The Performance Settlement Report delivers a clean, organized PDF for one performance. The Event Settlement Report is identical in format but sums every performance across the entire run — total donations, merchandise, and fees collected for the whole engagement. Both capture every order from the moment tickets go on sale through the event’s conclusion — ideal for internal teams, rental clients, co-producing partners, and grant reporting.
- Ticket sales by type — quantities and revenue for every price level, with comps called out
- Sales tax collected, product sales, and stand-alone plus add-on donations
- Fee revenue — the per-ticket fees you collect on each order
- Every adjustment itemized — coupons, exchanges, and refunds, already deducted from the totals
- Auto-emailed to stakeholders — send the event settlement to as many recipients as you like, with different addresses per production, so co-producers and renters stay current on sales progress
Compare every show, side by side
Select a custom date range — or simply drag over dates in your calendar — and get every performance in the window, grouped by event with automatic subtotals. No manual spreadsheets, just one data-rich comparison across seasons, weekends, and recurring events.
| Performance | Sold | Capacity | Revenue/Ticket | Products | Revenue |
|---|---|---|---|---|---|
| Fri 8:00 PM | 318 | 76% | $35.00 | $95 | $11,130 |
| Sat 2:00 PM | 289 | 69% | $33.01 | $70 | $9,540 |
| Sat 8:00 PM | 412 | 91% | $36.00 | $130 | $14,830 |
| Sun 2:00 PM | 244 | 58% | $32.99 | $45 | $8,050 |
| Event total (4) | 1,263 | 74% | $34.48 | $340 | $43,550 |
- Per performance — capacity, percent sold, tickets sold, and average revenue per ticket
- Performance day comparisons — Friday vs. Saturday totals, side by side at a glance
- Product totals — quantities and sales for concessions and merchandise, plus fees, shipping, and donations
- Payments & totals — collected by credit, cash, gift card, and split payments, with tax, net sales, and exchanges
- Built-in rollups — grand totals split by online vs. box office sales, with financial goal tracking per event
Match every deposit, without spreadsheets
Where settlements follow an event from on-sale to conclusion, the Reconciliation Report follows the calendar. Built for bookkeepers and accountants, it’s a purely date-driven CSV of every transaction in the range you choose — each line clearly identifying the event and performance it belongs to — so bank deposits match ThunderTix to the penny. It defaults to yesterday’s activity, or expand the range to a full month.
- Every transaction in the range — ticket orders, donations, merchandise, and concessions, each tagged to its event and performance
- The tricky stuff too — refunds from current and past orders, exchanges, voids, gift cards sold and redeemed, orders converted to donations, and tickets or products added onto existing orders
- A complete audit trail — payment and card type on every line, the staff member behind each sale or refund, and the reason recorded for every discount, refund, and override
Every sale, coded to your chart of accounts
Assign GL accounting codes to every revenue stream — tickets, fees, tax, products, donations, and class registrations — with venue-wide defaults and per-event overrides. Then export a clean, date-driven ledger your bookkeeper can drop straight into QuickBooks or any accounting system.
- One line per item — date, order ID, line type, GL code, GL name, description, and amount, with every column totaled at the bottom
- Defaults with overrides — one code for all events, or send a single show or class to its own account
- Ledger discipline built in — prior days are never restated, zero-dollar comps stay out, and cross-event exchanges post as paired debit-and-credit entries on the day they occur
| Line type | GL code | Description | Amount |
|---|---|---|---|
| Event | 4100 | Adult ticket | $38.00 |
| Fee | 4300 | Per-ticket fee | $3.50 |
| Tax | 2200 | Sales tax | $2.10 |
| Product | 4400 | Show t-shirt | $25.00 |
| Donation | 4600 | Add-on donation | $10.00 |
| Totals | $78.60 |
Order exports
Order-level data, sliced the way you need it for custom reporting and year-over-year comparisons.
- Export by sales agent, payment method, ticket type, date, or zip code
- Measure advertising effectiveness by geography and channel
Customer contact exports
Pull patron information for outreach, fundraising, and audience development.
- Search by name, phone, email, or past event attendance
- Build marketing lists and follow up with donors and supporters
Guest list & check-in records
A full digital manifest with real-time barcode scan data for total door transparency.
- View and export manifests with patron contact details, or print the guest list
- Track scans by timestamp and staff member; spot scanned vs. unscanned instantly
- Reprint tickets or thermal stubs right from the guest list screen
Segment & re-engage
Powerful filters plus built-in patron scoring for advanced analysis and audience targeting.
- Segment by zip code, purchase date, or past attendance
- RFM scores and lifecycle stages — every patron ranked by recency, frequency, and spend, and staged automatically from first-timer through active, lapsing, and won-back
- Find patrons who attended last year but haven’t purchased this season
- Send targeted mass email to any segment right from ThunderTix — or export it to Mailchimp or Constant Contact
Ticket sales reports FAQ
Every account includes the Analytics Dashboard, Performance and Event Settlement Reports, the Multi-Event Sales Report, the Reconciliation Report, the GL Codes accounting export, order and customer contact exports, guest lists with barcode check-in records, and segmentation tools — all out of the box, with no setup required.
Yes. The ThunderTix MCP connector links your account to AI assistants like Claude, so you can ask natural-language questions about your data — “compare weekday vs weekend sales by genre this season” — and get back a totally custom report. You can also ask Claude to visualize the results as graphs and charts ready for a board deck.
Bolt is the AI assistant built into ThunderTix. Ask it questions in plain English — how a show is pacing, where to find a report, how a number was calculated — and get rapid, accurate answers at all hours, day and night. Bolt works from your live account data and our full documentation.
Yes. The Reconciliation Report is a date-driven CSV of every transaction in the range you choose — ticket orders, donations, merchandise, refunds from current and past orders, exchanges, voided orders, gift cards sold and redeemed, orders converted to donations, and tickets or products added onto existing orders — with each line identifying the event and performance it belongs to, the payment and card type, the staff member on the sale or refund, and the reason recorded for any discount, refund, or override. It defaults to the previous day, can cover up to a full month, and matches bank deposits to ThunderTix transactions for your accounting software.
Yes. Assign GL or accounting codes across events, fees, tax, products, donations, and class registrations — with venue-wide defaults and per-event overrides. The export produces one line per item (date, order ID, line type, GL code, GL name, description, and amount) with column totals, follows strict ledger rules — prior days are never restated, and exchanges post as paired entries — and imports into QuickBooks or any accounting system.
That’s exactly what they’re designed for. The Performance Settlement Report is a clean, one-page PDF for a single performance covering ticket sales by type, sales tax, products, donations, and the per-ticket fees you collect — with coupons, exchanges, and refunds itemized for artist settlements and rental clients. The Event Settlement Report is identical in format but sums every performance across the full run, and can be emailed automatically to as many recipients as you like — with different addresses per production — keeping interested parties current on sales progress. Both reports include every order from on-sale through the event’s conclusion.
Yes. Order exports, customer contact exports, and the Reconciliation Report download as CSV files that open directly in Excel or Google Sheets, while settlement reports generate as clean PDFs. The GL Codes export produces an accounting-ready file for QuickBooks or any general ledger system.
Yes. Settlement reports itemize coupon redemptions and their value for a performance or an entire run, and the Reconciliation Report includes a coupon breakdown on every transaction, along with the discount amount and the reason recorded — so you can see exactly which promotions drove sales.
Yes. The Analytics Dashboard compares the current period against a previous one for instant trend analysis, and the Multi-Event Sales Report runs across any date range for side-by-side comparisons. For anything more specific — “compare this season’s musicals to last season’s” — ask Bolt, or use the MCP connector to have Claude build the comparison and chart it.
Yes. ThunderTix automatically scores every patron on recency, frequency, and monetary value (RFM) and assigns a lifecycle stage — from first-timer through active, lapsing, lapsed, and won-back. Use those scores and stages to spot your best customers, catch patrons about to slip away, and send targeted mass email before they do.
Sales reports, settlement reports, exports, and guest lists all run in real time, reflecting orders the moment they’re placed. Two views refresh nightly by design: the Analytics Dashboard, which summarizes trends across your operation, and the Reconciliation Report, so each day’s transactions are complete before you match them to bank deposits.
More ways to run on data
AI integration
The ThunderTix MCP connector — your data, connected to Claude and other AI assistants.
See the AI integrationPatron CRM
The customer database behind your exports, segments, and marketing lists.
See the CRMBox office
The sales operation your reports measure — POS, group sales, and reservations.
See box office toolsConversion tracking
Measure ad and campaign ROI with Google Tag Manager and tracking pixels.
See conversion trackingEmail marketing
Turn segments into targeted campaigns with revenue tracked per send.
See email marketingAll features
Everything you need to sell tickets, grow your audience, and run your venue.
Browse all featuresStart making smarter, faster decisions
Real-time ticket sales reports, beautiful settlement summaries, and AI that answers the questions in between — complete clarity and control for your team.