
How do customers learn about your events? What path did buyers take before making a purchase? Is your advertising working? These answers are available with Google Analytics. Google Analytics is the leader in providing businesses with insight about the effectiveness of marketing activities. In addition to identifying where customers came from, their platform can determine which landing page provides the best opportunity to convert a website visitor to a paid customer. They even establish how long a visitor remains on your site and confirm if your goals are being met.
ThunderTix makes it easy for you to integrate Google Analytics with your account. Analytics works by providing you with a snippet of code to add to your website pages and event listings. This snippet sends data back to Google to give an analysis of the paths customers take in the purchase process. Our copy and paste integration makes it a snap to get start receiving information. Let’s cover how to take advantage of today’s most powerful advertising platform.
Setting up your Google Analytics Property for ThunderTix
First, we need to find the public web address of your events on ThunderTix. This address takes the form of combining your account or venue name with the ThunderTix URL, for instance, https://YourAccount.thundertix.com. To locate this web address, login into your ThunderTix account. Next, head to your Public Display Settings, and click Edit Public Display. Your subdomain is listed at the top of the page under Public Display Options.

- First of all, sign in to your Google Analytics account, then go to the Admin section.
- Select an account from the dropdown in the Account column.
- Then select a property from the dropdown in the Property column and click Property Settings The “properties” are the list of websites that Google knows you control.
- If you haven’t already done so, make sure you create a separate property for your ThunderTix public web address as described above.
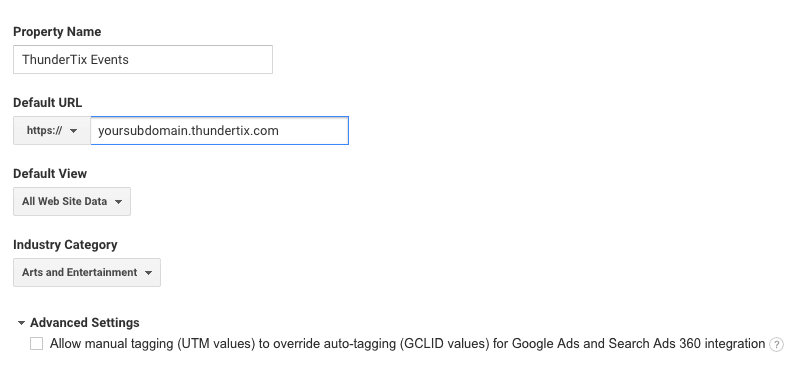 In the Property Name, enter something that lets you know it’s for your ThunderTix events.
 - Under Default URL, make sure you choose “https://” as the prefix and enter your ThunderTix web address.
- The Default View should be All Website Data
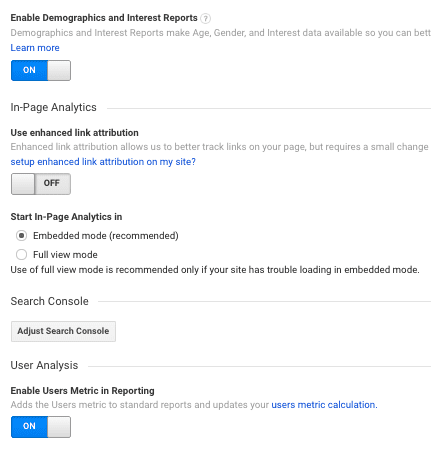
- Copy the remainder of the settings for demographics and setup as seen below.
- Finally, click Save when completed.
Connecting Google Analytics to ThunderTix
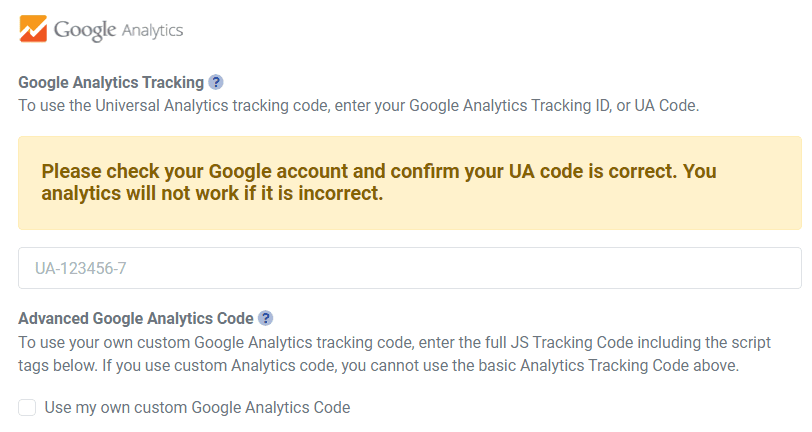
Next, you will need to locate your Google Analytics tracking code, or “UA Code.” The UA Code is a string like UA-000000-01. The first set of numbers (000000, in the example) refers to your account number. The second set (01, in the example) refers to the specific property number associated with the account. The property ID is in large font on the Tracking Info page. You can also to see the entire string in the first few lines of the tracking code.
- Inside your Google Analytics account, click Tracking Info from the menu on the left.
- Then, click Tracking Code.
- Copy your UA Code.
- Login to your ThunderTix account.
- Head to your Account Settings and click on Integrations and Pixel Tracking.
- On the right side of the page under the Google Analytics heading, paste your UA code in the space provided.
- Your changes will automatically save.
Congratulations! ThunderTix and Google Analytics integration is now complete! ThunderTix will insert the appropriate tracking code into of all pages of your event website from your ThunderTix account.
Typically, Google Analytics needs 24 hours to accumulate all the various data points, so try to be patient. However, some of the real-time tracking data is available immediately.
Integrating Google Analytics
The primary functions of ThunderTix’s integration with Google Analytics are:
- Tracking referrers
- Tracking Ticket sale goal conversions
- Optimizing the ticket purchase process
Tracking referrers
Tracking referrers lets you see which website page are referring ticket buyers to your site. As a result, you’ll see how many buyers those websites are sending to you and which webpages are the most popular. Finally, the Google Analytics tells you how those buyers interact with your website.
If you’re trying to build a stream of potential customers from referrals (like websites that list your upcoming events), you want to know which websites are successful sources for new business. For example, your venue may be listed on a ‘What To Do Tonight’ section of a popular website. If so, you’ll want to see whether being listed there is driving new customers to your site. And further, whether they are buying tickets from that website.
The Google Analytics referrer data lets you see visitors arriving on your website from expected sources. In addition, it also makes you aware of unexpected sources, such as a music review or news story you didn’t know about. Or, a popular blogger who discovered your site and linked to it.
If you want to investigate a source of buyers arriving on your venue’s website, click on the name of the referring website (called a “source domain”) to see the specific external webpages that are driving new customers (“referral path”). Click on the referral path to the external website address to visit the referring page in order to see the context in which your site is linked. Pairing external sources of new business with your ThunderTix sales data will shed new light on how well your advertising is doing. If 10,000 people arrived from the ‘What To Do Tonight’ website, and 213 ended up buying tickets, you know the per person value of the referrer.
Ticket Sales Goal Conversions
Ticket sales goal conversions are where your Google Analytics account and your ThunderTix account are most closely connected. Create a new “goal” in Google Analytics to track how many visitors turn to paying customers. Once done, buyer activity during the purchase process will be tracked and you will be able to see what percentage of purchases were successful (event sale vs. abandoned cart).
Note – Google Analytics are designed for any type of business, not just venues and events, so you may notice the default language used to describe the various goals is different than what you use internally. Know that Google Analytics lets you set your own goal descriptions, which is an opportunity to use the wording that is already familiar to you. It helps to couch Google Analytic goal conversion descriptions in the same event-friendly language used inside your ThunderTix account.
In basic terms, Google Analytics needs to know the webpage addresses, or URLs, for each step in your ticket sale purchase process. In your Google Analytics account, start at the admin view, then click ‘Goals’ and ‘Create a goal’ until you have the goal editing screen open. The most common ticket sale goal is what Google Analytics calls a “destination” goal type, that normally has three steps, culminating in a sale.
Follow the instructions in our setup guide on setting up a Goal in Google Analytics to track sales.
Monitoring Goal Conversions
With the goal built for your account, every time a consumer initiates the ticket purchase, Google Analytics will record their actions and all event pages visited. Should the purchase process be completed with an event order processed, that is considered a ticket sale goal conversion. Your Google Analytics account tracks each recorded goal conversion and if you have assigned a monetary value to each goal conversion, Google Analytics will total up the dollar amounts in what it calls goal values. Pass the actual value of an order made in ThunderTix to your Google account to measure your ROI from conversion tracking.
Tracking goal conversions
After you have set up your goals, give yourself a couple of days to let people enter the ticket purchase process on your website. Once website visitors begin to complete goals, visit the “Conversions” section of your Google Analytics account for tracking information about these completed goals. You will be taken to a “Goals Overview” page which displays your goal completions, total goal value, and goal conversion rate percentage over the last thirty days. Yes, Google Analytics is a long-term process, but there is a less robust “real-time” view of visitors to your website.
It is important to set the expectation for yourself that a certain percentage of people start the ticket purchase process but never complete it. That is not inherently a “bad” thing. Google Analytics has extensive tools to help you understand all the data that accumulates for ticket sale goal conversions.
Tracking goal conversions isn’t an overnight process. You’ll want to monitor and improve your results over time. It might mean using more exciting images, expanding your descriptions, or even changing the color of the “Buy” button. The key is to continue to make small improvements over time. Consequently, your traffic and conversion rate should rise.
Extensive support resources written specifically about goal conversions are available on the Google Analytics website.
Optimizing the ticket purchase process
 By observing the various paths your customers take across your website, you can make note of where the purchase process succeeded (“conversion”) and where it broke down (“cart abandonment”). This is the function of Google Analytics Goal Flow report.
The Goal Flow Report visualizes the path your website visitors traveled through a funnel towards a Goal. This report can help you see if visitors are navigating through your website as you expect them to – ultimately leading to a ticket sale.
The final node you see in a Goal Flow report represents the goal, and the other nodes represent funnel steps. Visitors that travel through the funnel and exit at the goal have completed your objective, or converted.
Use the Google Analytics Goal Flow Report to investigate questions like:
- Where do new visitors enter my my website – at the first step, or are they jumping in somewhere in the middle?
- Are there a lot of unexpected exits (cart abandonment) from a step in the middle of the funnel?
- Is there one type of ticket buyer that acts differently than others? Which types of events are converting ticket sales goals more or less often?
After reviewing a Google Analytics Goal Flow report, should you notice a pronounced amount of cart abandonment, that is an opportunity to improve. One section, or funnel node, shows hundreds of people poised to click the “Buy Tickets” button, but suddenly they don’t make it to the next step in the purchase process. Why? After an evaluation and making any necessary corrections, revisit the Goal Flow Report in a few weeks to see if the changes you made improved the conversion rate for that specific ticket sales goal.
It is important to note the functions covered here will help you make the most immediate use of Google Analytics. There are many other features available. Consider reviewing Google’s numerous support resources.