This event reports menu guide explains the reports available to you in the drop-down menu of the reports tab. If you have any other questions, check out our other report guides, the event dashboard guide and the ticket sales reports guide. For any further help, take a look at our event software reports video or visit our support forum.
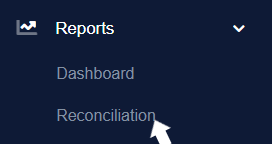
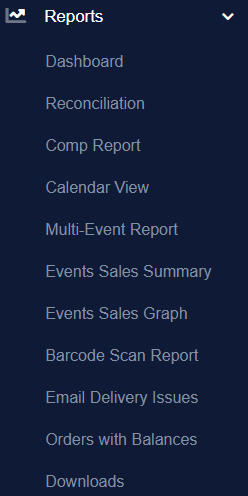
The reports menu/tab provides several different sales report options. Once you have clicked on the "Reports" tab, located in the left-hand navigation bar, you can access the event analytics dashboard, reconciliation reports, multi-event sales reports, single event sales reports, the event sales summary, event sales graphs, as well as barcode scan reports.
Along with accessing the reports mentioned above, you may also view your upcoming or expired events in the calendar view.
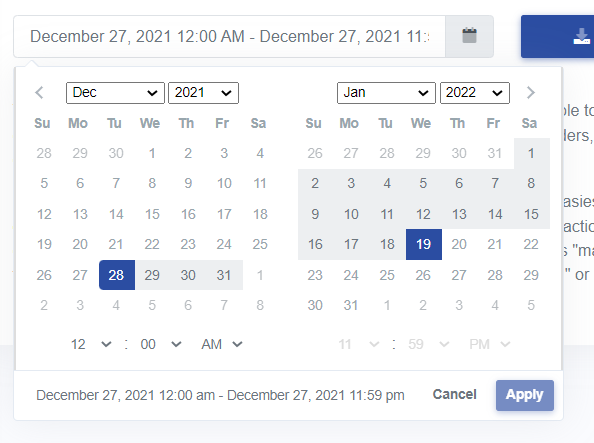
If you’re looking for a report that includes all daily transactions to help with bank reconciliation, you need the Reconciliation Report. The event reconciliation report includes all ticket orders, donations, product and gift card purchases, refunds from previous orders, and exchanges as well as voided orders. You can also export this report from any time period you would like, for up to one month. However, due to variations in gateway report, do take a moment to read how to manipulate the gateway report to match your incoming orders.
To generate a reconciliation report, you must:
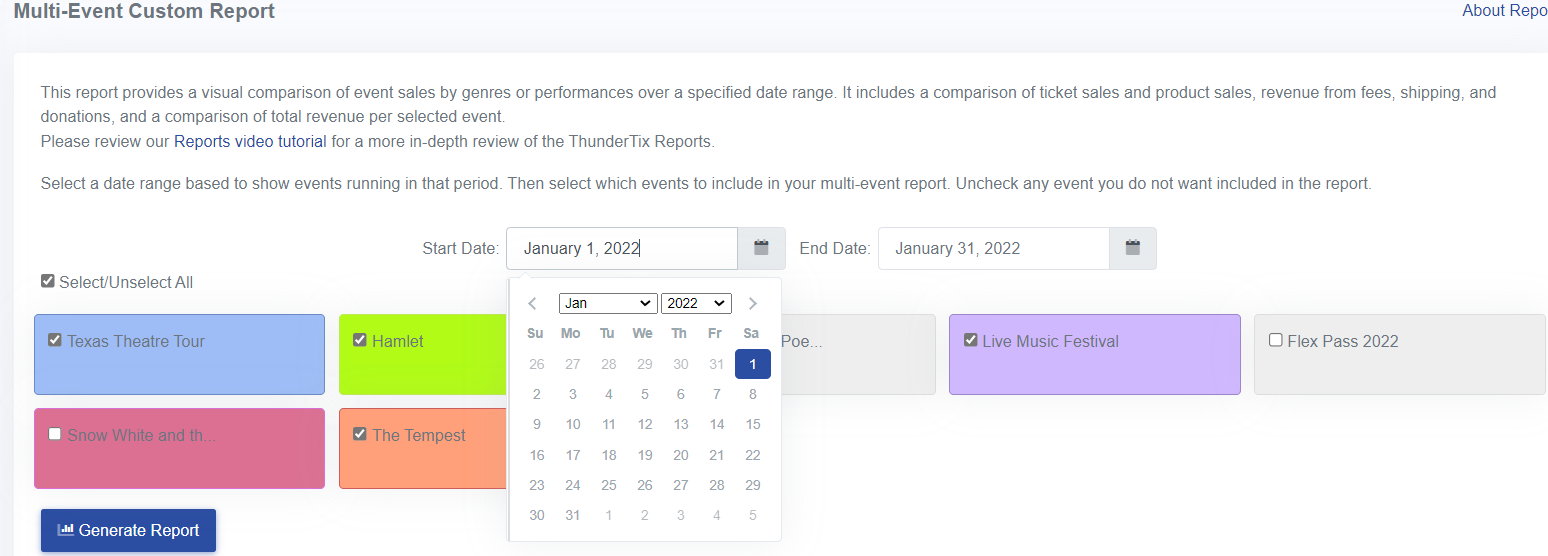
Multi-Event Sales reports will show all the ticket sales, exchanges, other revenue for each individual event you choose and the total sales from the box office, Facebook, the public, as well as gross sales. You can access multi-event sales reports from the reports tab drop-down menu or from the calendar view.
To generate a multi-event sales report, you must:
To see all your events on a calendar view, hover over the reports tab and click calendar view.
From this page, you can see a monthly, weekly, or daily view of your events. You can also export monthly, weekly, daily, or single event sales reports. These reports show a detailed overview of the sales for each event included in that time frame.
The calendar view also lets you color code events for your own display and display on the calendar shown to the public. To change the color of an event, click on the down arrow icon corresponding to your desired event in the left column.
From the calendar view, you can also generate multi-event sales reports for specific months, weeks, or days.
To generate multi-event sales reports, you need to:
Tip: To exclude events from the report, find the event in the left menu and click the “X” to have the event hidden from the Calendar view prior to generating the report.
You can also export a multi-event sales report for all the performances of a single event by clicking on the bar graph icon located next to the event to the left of the calendar.
Additionally, you can export a single event sales report from the calendar page. A single event's sales report shows a detailed overview of all the sales as well as shipping costs, fees, and donations collected. It also shows the coupons used, costs comped, and exchanges.
To access a single event sales report, you need to:
From this pop-up, you can also access the guest list for the event. Clicking the Guest List button will take you to the guest list for that event and from there you can check-in guests or export the guest list.
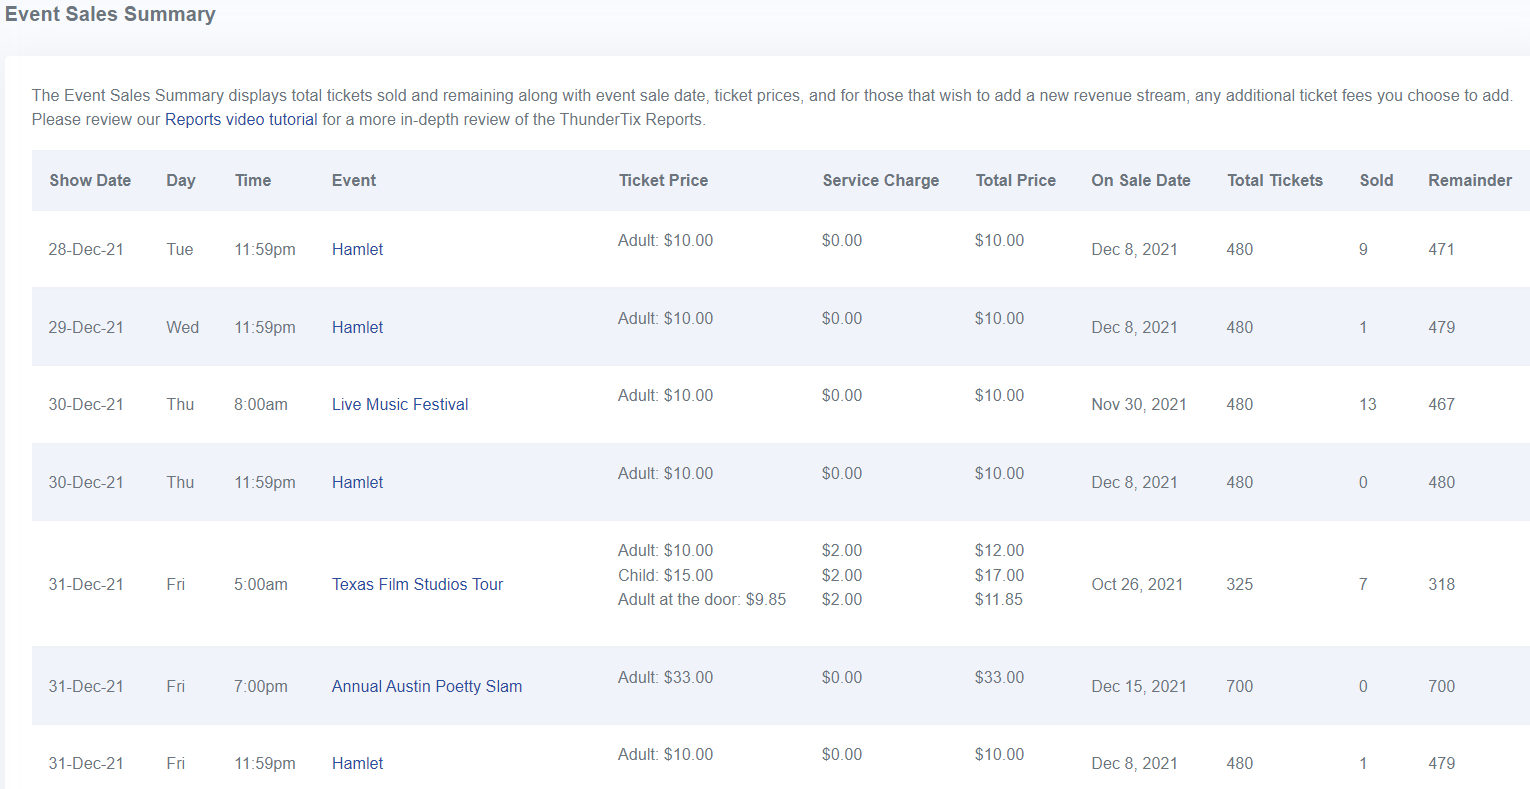
From the Reports tab, you can also access a summary of your events showing the set prices, fees and tickets sold.
The Event Sales Summary is a quick way of seeing how all your events are selling and what the prices and fees are.
The Event sales graph allows you to visually see how your events are selling. This is a bar graph comparing revenue and ticket sales per upcoming event. Additionally, hover over the revenue bar or the tickets sold bar to see the total amount of tickets sold or the total revenue.
The Barcode Scan Report shows Barcodes Scanned by day. This report provides a PDF document of all barcodes scanned across all events on a single day. The document will be separated first by each staff member scanning tickets and then by ticket type. Rather than showing the actual barcode IDs, this report provides a total summary of each ticket type scanned by user.
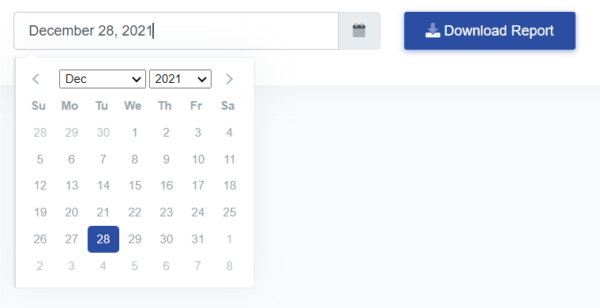
To generate a barcode scan report, you must:
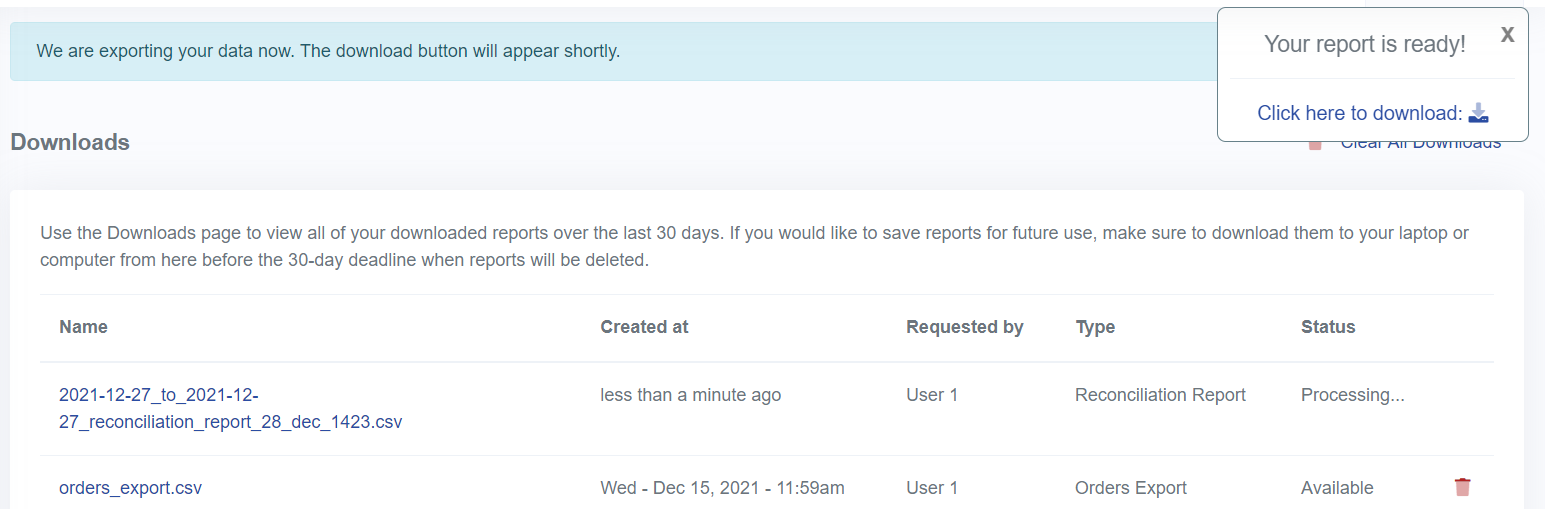
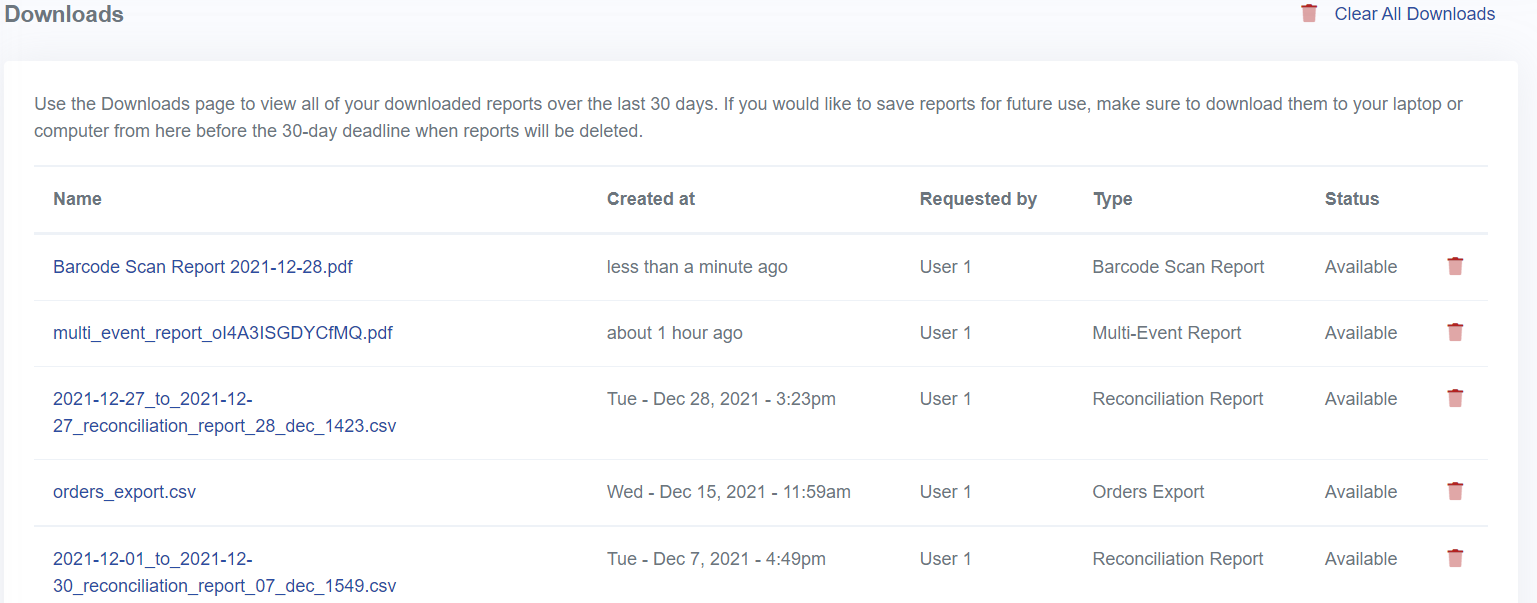
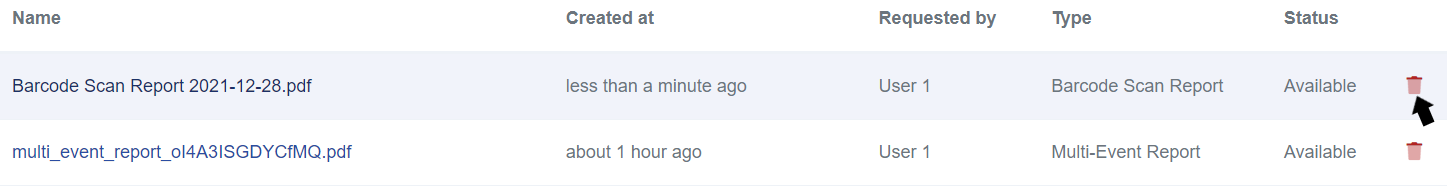
Whenever you export or generate a report, you will be taken to this page. The downloads page is where all of your reports can be downloaded from. To access it, you just need to hover your mouse of the reports tab and click on Downloads.
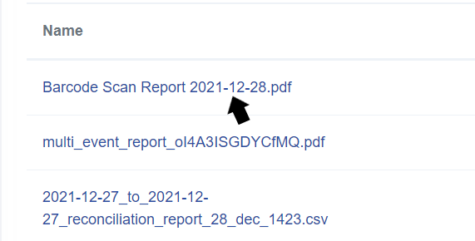
On this page, you can click on any report to open it or download it to your computer. If the file you click on is a PDF, it will open, and you will have to click the download button in the top right corner. If the file you click on is a CSV, your computer will prompt you to choose an application to open the file in.
You also have the ability to delete past downloaded reports by clicking on the red x in the corresponding row of your desired event.
Downloaded reports are stored for only 30 days, so make sure you save a copy of anything you want to retain permanently. You can also clear all downloads by clicking on the "Clear All Downloads" button located in the top right corner.